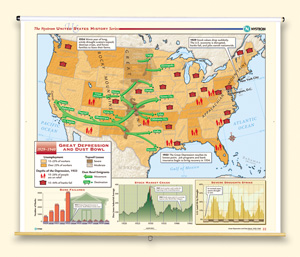
GREAT DEPRESSION AND DUST BOWL, 1929–1940
Map on spring roller with backboard
Connect with a representative to create a custom curriculum for your district.
Shading shows the unemployment percentage in each state (15–25% or over 25%), as well as areas with moderate or severe topsoil losses. Symbols denote areas where, in 1933, 15–26% of people were on relief, and where 15–44% of banks failed. Arrows show paths of migration, with road-sign symbols representing main destinations for migrants. Thee graphs are at the bottom: one shows bank failures by year from 1929 to 1940; the next shows the Dow Jones Industrial Average from 1920 to 1945; and the last shows levels of drought from 1929 to 1940.
This title is part of the series: THE NYSTROM COMPLETE U.S. HISTORY MAP SET

