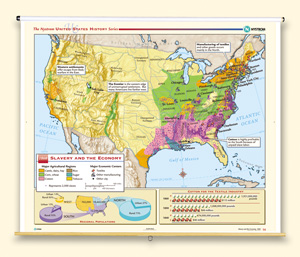
SLAVERY AND THE ECONOMY, 1860
Map on spring roller with backboard
Connect with a representative to create a custom curriculum for your district.
Color shading shows the major agricultural areas at the time and what they produced (cattle, dairy, hay; corn, wheat; cotton; rice; sugar; tobacco). Symbols indicate major areas for textile or other manufacturing. One inset at the bottom shows regional population, and the other shows the weight (in pounds) and the worth (in dollars) or cotton produced for the textile industry in 1840, 1850, and 1860.
This title is part of the series: THE NYSTROM COMPLETE U.S. HISTORY MAP SET

