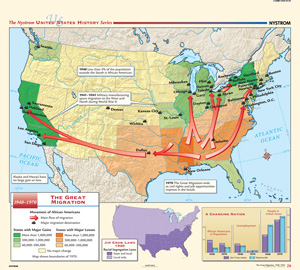
THE GREAT MIGRATION, 1940–1970
Map on spring roller with backboard
Connect with a representative to create a custom curriculum for your district.
Arrows show the main flows of migration of African Americans, symbols denote major migration destinations, and color shading differentiates states with major population gains from those with major population losses. One inset at the bottom focuses on Jim Crow laws in 1940, using color shading to differentiate areas that had state and local segregation laws from ones that only had local laws. The other inset has bar graphs comparing Jim Crow states with the rest of the nation in 1940 and 1970 in terms of African Americans in the population, unemployment, and people residing in urban areas.
This title is part of the series: THE NYSTROM COMPLETE U.S. HISTORY MAP SET

